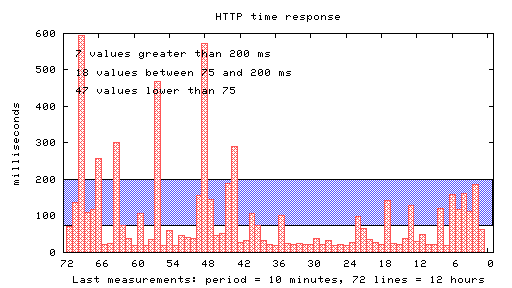
During this last week a webserver of mine appears to be very slow. This webserver is made by a CMS, so any page is load after making some SQL query to a DB.
Since a wget of a static jpg image has a normal speed, while is not fast as usual to load any page, I convinced myself to monitor the database performances.
I made a simple monitoring by 3 steps.
Step 1: I wrote a php simple page for my webserver to make a db connection, executing a couple of queries and telling me the needed time to get te response. Calling my http://www.mywebsite.org/test.php I’m able to read the result. My php script is
<?php
function diff_microtime($mt_old,$mt_new) {
list($old_usec, $old_sec) = explode(‘ ‘,$mt_old);
list($new_usec, $new_sec) = explode(‘ ‘,$mt_new);
$old_mt = ((float)$old_usec + (float)$old_sec);
$new_mt = ((float)$new_usec + (float)$new_sec);
return $new_mt – $old_mt;
}$ti=microtime();
echo “STARTING SQL EXECUTION: “. $ti .”<br>”;
$dbhost = ‘localhost’;
$dbuser = ‘mydbusername’;
$dbpass = ‘supersecretpassword’;
$conn = mysql_connect($dbhost, $dbuser, $dbpass) or die (‘Error connecting to mysql’);$dbname = ‘mydatabase’;
mysql_select_db($dbname);echo ‘TABLE STRUCTURE FOR <i>cms_module_visitorstats</i>:<br>’;
$res = mysql_query(‘DESCRIBE cms_module_visitorstats’);
while($row = mysql_fetch_array($res)) {
echo “{$row[‘Field’]} – {$row[‘Type’]} <br>\n”;
}
$res = mysql_query(‘SELECT count(*) from cms_module_visitorstats;’);
while($row = mysql_fetch_array($res)) {
echo “<br>{$row[0]} Records in <i>cms_module_visitorstats</i><br>”;
}mysql_close($conn);
$tf=microtime();
echo “ENDOF SQL EXECUTION: “. $tf .”\n<br>\n”;
echo “TIME ELAPSED “. (1000 * number_format(diff_microtime($ti, $tf), 3) ).” milliseconds”;
?>
Step 2: I wrote a shell script on freeshell.eu in order to call from crontab my php remote script and writing my measures on a log file. My crontab looks like this:
1,11,21,31,41,51 * * * * bin/getdata.sh
and my shell script, is simply:
#!/bin/sh
OUTFILE=”public_html/test/sqlprau.log”
cd
touch $OUTFILE
MILLI=`lynx -dump http://www.mywebsite.org/test.php|grep “TIME ELAPSED” | awk ‘{ print $3}’`
SECON=`date “+%d/%m/%Y %H:%M:%S – %s – “`
echo $SECON $MILLI >> $OUTFILE
Step 3: Thanks to perl and gnuplot programs, getting some help from this manual, I was able to write this simple perl cgi-bin to read the file made in the step 2 and show a sort of graphic like the following.
Yes, now I’m sure my website appears to be slow.
