Posts Tagged ‘nagios’

a nagios check to remind me the SSL certificate expiration

Monday, March 3rd, 2014

I wrote a quite unuseful check for nagios to remind me to renew my SSL certificate. This is the definition in commands.cfg file

define command{
        command_name check_ssl_expiration
        command_line /usr/lib/nagios/plugins/check_ssl_expiration.sh $ARG1$ $ARG2$ $ARG3$ $ARG4$
}

and this the check_ssl_expiration.sh script

#!/bin/bash
# input parameters
MYSRV=$1
MYPORT=$2
DAYWARN=$3
DAYCRIT=$4
# return values
RET_OK=”0″
RET_WARN=”1″
RET_CRIT=”2″
RET_UNKN=”3″
TEMPFILE=/tmp/.$$certtest.pem

# check data input
checkdata () {
        VAL=`echo $2 | wc | awk ‘{print $2}’`
        if [ $VAL -eq 0 ]; then
                echo $1 is not set
                exit $RET_UNKN
        fi
}

checkdata “HTTPS server name” $MYSRV
checkdata “HTTPS PORT” $MYPORT
checkdata “warning threshold” $DAYWARN
checkdata “critical error threshold” $DAYCRIT

echo | openssl s_client -connect $MYSRV:$MYPORT  2> /dev/null | sed -ne ‘/-BEGIN CERT/,/-END CERT/p’ > $TEMPFILE 2>/dev/null
EXPDATE=`openssl x509 -noout -in $TEMPFILE -dates|grep notAfter|sed -e “s/.*notAfter=//”`
rm $TEMPFILE

EXPSEC=`date “+%s” –date=”$EXPDATE”`
NOWSEC=`date “+%s”`
DAYLEFT=`expr \( $EXPSEC – $NOWSEC \) / 86400`

# $DAYLEFT days left to SSL certificate expiration

if [ $DAYLEFT -le $DAYCRIT ]; then
        echo “ERROR – $DAYLEFT days left to SSL certificate expiration for $MYSRV:$MYPORT”
        exit $RET_CRIT
fi

if [ $DAYLEFT -le $DAYWARN ]; then
        echo “WARNING – $DAYLEFT days left to SSL certificate expiration for $MYSRV:$MYPORT”
        exit $RET_WARN
fi

echo “$DAYLEFT days left to SSL certificate expiration for $MYSRV:$MYPORT”
exit $RET_OK

Off course I scheduled this check once a day.

A nagios plugin to check Tomcat Apps

Wednesday, February 5th, 2014

I wrote a simple nagios plugin to check the status of tomcat webapps.
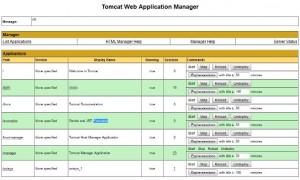
Instead of looking pages like this one…
click to enlarge
I’d better to use some script like this.
To put the plugin in the nagios environment, add these lines

define command{
command_name check_tomcat_app
command_line /bin/bash /usr/lib/nagios/plugins/check_tomcat_app $ARG1$ $ARG2$ $ARG3$
}

to the commands.cfg file definitions.Then add some line like theese

define service{
use generic-service
host_name myhostname
service_description Examples Web Service
is_volatile 0
check_period 24×7
max_check_attempts 3
normal_check_interval 15
retry_check_interval 1
contact_groups admins
notification_interval 240
notification_period 24×7
notification_options c,r
check_command check_tomcat_app!”http://tomcatserver.my.lan:8080/manager/html/list”!Examples!admin:passw
}

into the services.cfg file.
Off corse username and password has to be set up in tomcat-users.xml file

$ cat /usr/local/apache-tomcat/conf/tomcat-users.xml
<?xml version=’1.0′ encoding=’utf-8′?>
<tomcat-users>
<role rolename=”manager”/>
<role rolename=”admin-gui”/>
<role rolename=”manager-gui”/>
<role rolename=”manager-status”/>
<user username=”admin” password=”passw” roles=”manager,manager-gui,manager-status,admin-gui”/>
</tomcat-users>

DHCP available address value monitored with nagios

Wednesday, September 14th, 2011

I have a DHCP server that sometime has no free IP addresses to assign. What can I do to monitor how many IP are still available?

Well, perl and NSClient++ installed on my Micro$oft DHCP server, I wrote a simple program to execute and parse the command

netsh dhcp server show mibinfo

that gives some output containing the data I need. The source is quite simple: it assume the DHCP server is on a 10.20.x.y network and prints a list of comma separated numbers: the network (30 means 10.20.30.0/24), the assigned address number, the free address number.

#!/bin/perl
# the output will be a list like this:
#       (30,74,95) (31,139,7) (32,110,1)

$mystr=””;
@myoutput=`netsh dhcp server show mibinfo`;
foreach $myrow (@myoutput) {
if ( $myrow =~ /Subnet = 10\.20\.(.*)\.0\./ ) {
$mystr = $mystr . “($1,”;
}
if ( $myrow =~ /(.*) Addresses in use = (.*)\./ ) {
$mystr = $mystr . “$2,”;
}
if ( $myrow =~ /(.*) free Addresses = (.*)\./ ) {
$mystr = $mystr . “$2) “;
}
}
print “$mystr”;

Then I needed to add this line to the nsc.ini file, in order to run my perl script remotely

check_dhcp=C:\NSClient++\scripts\check_dhcp.pl

Once restarted the NSClient service, from my nagios server it’s possible to get the result from command line:

$ /usr/lib/nagios/plugins/check_nrpe -H myserverdhcp -c check_dhcp
(31,75,94) (32,144,2) (33,111,0)

A simple bash script plugin can be written to parse the result and getting nagios able to monitor the DHCP free address number value. E.g. this

#!/bin/bash
MYHOST=$1
MYNET=$2
ThresholdWARN=$3
ThresholdCRIT=$4
# Return values
RET_OK=”0″
RET_WARN=”1″
RET_CRIT=”2″
RET_UNKN=”3″

checkdata () {
VAL=`echo $2 | wc | awk ‘{print $2}’`
if [ $VAL -eq 0 ]; then
echo $1 is not set
exit $RET_UNKN
fi
}

# MAIN
checkdata “Remote IP” $MYHOST
checkdata “Network number” $MYNET
checkdata “Threshold WARN” $ThresholdWARN
checkdata “Threshold CRIT” $ThresholdCRIT

MYRETSTRING=`/usr/lib/nagios/plugins/check_nrpe -H $MYHOST -c check_dhcp`
MYFREEADDR=`echo $MYRETSTRING | sed -e “s/.*($MYNET,//” | sed -e “s/).*//” | sed -e “s/.*,//”`
checkdata “IP number” $MYFREEADDR

EXTRAMESSG=”|’DHCPfreeAddr’=$MYFREEADDR$MYNET””;$ThresholdWARN;$ThresholdCRIT”
if [ $MYFREEADDR -lt $ThresholdCRIT ]; then
echo “CRITICAL – Only $MYFREEADDR IP Available for $MYNET network$EXTRAMESSG”
exit $RET_CRIT
fi
if [ $MYFREEADDR -lt $ThresholdWARN ]; then
echo “WARNING – Only $MYFREEADDR IP Available for $MYNET network$EXTRAMESSG”
exit $RET_WARN
fi
echo “OK – $MYFREEADDR IP Available for $MYNET network$EXTRAMESSG”
exit $RET_OK

Then nagios has to be set up with the usual lines in the command configuration file

define command{
command_name check_nt_dhcp
command_line /usr/lib/nagios/plugins/check_nt_dhcp.sh $HOSTADDRESS$ $ARG1$ $ARG2$ $ARG3$

And in the services file:

define service{
use                             generic-service         ; Name of service template to use

host_name                       dhcpserver
service_description             Free IP on 10.20.33.0 network
is_volatile                     0
check_period                    24×7
max_check_attempts              10
normal_check_interval           30
retry_check_interval            30
contact_groups                  admins
notification_interval           240
notification_period             24×7
notification_options            c,r
check_command                   check_nt_dhcp!33!10!5
}
 

Nagios monitoring imap active connections

Wednesday, June 15th, 2011

To monitor with nagios the number of imap sessions running on a mail server, I used this way.

First, the command definition

define command {
command_name  check_imapd_conn
command_line  /usr/lib/nagios/plugins/check_imap_conn $HOSTADDRESS$ $ARG1$
}

Second, the check definition

define service{
use                             generic-service
host_name                       myimapserver
service_description             IMAP Connections
is_volatile                     0
check_period                    24×7
max_check_attempts              3
normal_check_interval           5
retry_check_interval            1
contact_groups                  admins
notification_interval           240
notification_period             24×7
notification_options            c,r
check_command                   check_imapd_conn!public
process_perf_data               1
}

The script is this:

#!/bin/bash

HOSTNAME=$1
COMMUNITY=$2

RET_OK=”0″
RET_WARN=”1″
RET_CRIT=”2″
RET_UNKN=”3″

checkdata () {
VAL=`echo $2 | wc | awk ‘{print $2}’`
if [ $VAL -eq 0 ]; then
echo $1 is not set
exit $RET_UNKN
fi
}

# MAIN
checkdata “HOSTNAME” $HOSTNAME
checkdata “COMMUNITY” $COMMUNITY

STR=`/usr/bin/snmpget -v 2c -c $COMMUNITY $HOSTNAME .1.3.6.1.4.1.2021.8.1.101.5 | sed -e “s/.*STRING: //” | awk ‘{print $1}’`
NCONN=`echo $STR|sed -e “s/of.*//”`

# The Maximum number taken from imap configuration file after the “of” in output string
CRITVAL=`echo $STR|sed -e “s/.*of//”`

# warning at the 85%
WARNVAL=`expr $CRITVAL \* 85 / 100`

PERFSTR=”‘IMAP Connections’=$NCONN;$WARNVAL;$CRITVAL”
if [ “$NCONN” -gt “$CRITVAL” ]; then
echo “ERROR: Too much IMAPD connections ($NCONN) max is $CRITVAL.|”$PERFSTR
exit $RET_CRIT
fi

if [ “$NCONN” -gt “$WARNVAL” ]; then
echo “WARNING: $NCONN IMAP connections (max is $CRITVAL).|”$PERFSTR
exit $RET_WARN
else
echo “$NCONN concurrent IMAP connections (max is $CRITVAL).|”$PERFSTR
exit $RET_OK
fi

on my IMAP server I wrote this simple script:

#!/bin/sh
IMAPSRVIP=10.11.12.13
CONNATT=`sudo netstat -natp|grep $IMAPSRVIP:143|wc -l`
CONNMAX=`grep imap /etc/cyrus.conf|grep -v \#|sed -e “s/.*maxchild=//”|awk ‘{print $1}’`

RETVAL=”$CONNATT”of”$CONNMAX”
echo $RETVAL

the script full path is in the server snmpd.conf

#  Arbitrary extension commands
exec IMAPConn /bin/sh /usr/local/snmpd-scripts/cnt_imap.sh

The sudo for netstat command in the script is needed to avoid an output line this

(No info could be read for “-p”: geteuid()=2002 but you should be root.)

Off corse, to make the sudo works as expected it’s needed to add a line like

snmp    ALL=NOPASSWD:   /bin/netstat

in sudo configuration.

a nagios plugin to monitor clamav status

Tuesday, April 12th, 2011

To monitor if a clam-av program on my mailserver is up to date, I set up the following trick.

first: I redirected on a file the freshclam output:

# 6 hours period virus definition update
7 1,7,13,19 * * * /usr/local/bin/freshclam > /var/log/clamav/freshcron.latest 2>&1

In case of out of date version, my file should looks like

# cat /var/log/clamav/freshcron.latest
ClamAV update process started at Wed Feb  9 07:07:01 2011
WARNING: Your ClamAV installation is OUTDATED!
WARNING: Local version: 0.96.5 Recommended version: 0.97
DON’T PANIC! Read http://www.clamav.net/support/faq
Connecting via …… etc.

otherwise no line starting with the word worning in uppercase or the string recommended is present.
Second step: a script called by SNMP has set on my mailserver by adding the following line to /etc/snmp/snmpd.conf:

exec ClamVrfy /bin/sh /usr/lib/nagios/plugins/clamd_check.sh

the script source is

#!/bin/sh
PROCRUNNING=`ps -C clamd | wc -l`
VERSIONUPD=`grep Recommended /var/log/clamav/freshcron.latest`
echo $PROCRUNNING \”$VERSIONUPD\”

Third step: congiguration of my nagios setup adding

define command {
command_name  check_update_clamd
command_line  /usr/lib/nagios/plugins/check_clam_update $HOSTADDRESS$ $ARG1$ $ARG2$ $ARG3$
}

to command definitions, and

define service{
use                             generic-service

host_name                       mymailserver
service_description             CLAM-AV DEFS UPDATE
is_volatile                     0
check_period                    24×7
max_check_attempts              3
normal_check_interval           5
retry_check_interval            1
contact_groups                  admins
notification_interval           240
notification_period             24×7
notification_options            c,r
check_command                   check_update_clamd!public!2!5
process_perf_data               1
}

to services.
My plugin script is:

# cat /usr/lib/nagios/plugins/check_clam_update
#!/bin/bash

# Input parameters
HOSTNAME=$1
COMMUNITY=$2
MYVALWARN=$3
MYVALCRIT=$4

# Return Values
RET_OK=”0″
RET_WARN=”1″
RET_CRIT=”2″
RET_UNKN=”3″

checkdata () {
VAL=`echo $2 | wc | awk ‘{print $2}’`
if [ $VAL -eq 0 ]; then
echo $1 is not set
exit $RET_UNKN
fi
}

# MAIN
checkdata “HOSTNAME” $HOSTNAME
checkdata “COMMUNITY” $COMMUNITY

STR=`/usr/bin/snmpget -v 2c -c $COMMUNITY $HOSTNAME .1.3.6.1.4.1.2021.8.1.101.3 | sed -e “s/.*STRING: //”`

if [ “$STR” -ge “$MYVALCRIT” ]; then
echo “Clamd Antivirus Definition DB is Out of Date”
exit $RET_CRIT
else
if [ “$STR” -ge “$MYVALWARN” ]; then
echo “Clamd Antivirus Definition DB is Quite Old”
exit $RET_WARN
else
echo “Clamd Antivirus Definition DB is Up to Date”
exit $RET_OK
fi
fi


wrapped nagios plugin to enable performance data

Tuesday, December 29th, 2009

In the nagios world, PNP4Nagios is an useful tool for collecting measures and drawing a graphic, e.g. to show the use of a monitored resource.
A plugin for PNP4Nagios is useful if it’s able to write some performance data.

So, the plugin output should be something like

PING OK – Packet loss = 0%, RTA = 0.26 ms|’ping reply time’=26ms

instead of

PING OK – Packet loss = 0%, RTA = 0.26 ms

If Your plugin does’n write performance data, You can put a simple shell scritp between nagios and the plugin with a small modification of Your nagios config.

  1. /etc/nagios/commands.cfg

    define command{
    command_name wrapped_ping
    command_line /usr/lib/nagios/plugins/wrapped_ping $HOSTADDRESS$ $ARG1$ $ARG2$
    }

  2. /etc/nagios/services.cfg

    define service{
    use generic-service ; Name of service template to use

    host_name intranet
    service_description PING
    is_volatile 0
    check_period 24×7
    max_check_attempts 3
    normal_check_interval 5
    retry_check_interval 1
    contact_groups admins
    notification_interval 120
    notification_period 24×7
    notification_options w,u,c,r
    check_command wrapped_ping!100.0,20%!500.0,60%
    }

  3. /etc/nagios/serviceextinfo.cfg

    define serviceextinfo {
    host_name intranet
    service_description PING
    action_url /nagios/share/index.php?host=$HOSTNAME$&srv=$SERVICEDESC$
    }

Here You can download my version of the wrapped_ping shell script I wrote.

nagios plugin using expect and shell scripting

Tuesday, October 13th, 2009

In some cases, if You need to monitor some remote host resource without SNMP or any other simplest way, maybe You need to write a shell nagios plugin calling an expect script. A quite strange way, I admit.

Well, You can write something like that:

MYRESULT=$(/usr/bin/expect – << EOF
set timeout -1

spawn ssh $MYUSERNAME@$MYHOSTNAME
expect {
ssword: {
send “$MYPASSWORD\r”
}
}
expect {
bash-prompt {
send “$MYCOMMAND\r”
}
}
expect {
bash-prompt {
send “exit\r”
}
}
EOF)

Windows monitoring with nagios

Friday, May 22nd, 2009

Nagios is a good monitoring system in the GPL world.

You can be informed in “real time” about the state of your systems, even if You need to know the state of a M$ host. 😉
Recently I have found a strange error in monitoring a Windows host: NSClient – ERROR: Could not get data for 5 perhaps we don’t collect data this far back? or NSClient – ERROR:Failed to get PDH value.

A strange error from a windows host

A strange error from a windows host

In the NSClient++ logs, I found some strange lines like this:

\PDHCollector.cpp(133) Failed to open performance counters: \?¦ƒ¦(_total)\?¦ƒ¦: PdhAddCounter failed: -1073738824: The specified object is not found on the system.

The solution is in rebuilding the performance counter files. On windows 2003 this could be done with:

C:\> lodctr /R